Tangles in Images I
This page is a read-only extract from an interactive tangle software tutorial, with the same title, which is offered in the form of a jupyter notebook on our GitHub page. The steps required to run it are described there, in the 'getting started' section.
To follow the tutorial, you should first read the following sections in Diestel's Tangles book.
- Chapter 1.3, Tangles in data science;
- Chapter 6.2, Tangles in pixels: clusters in images;
- Chapter 7.4, The evolution of tangles: hierarchies and order;
- (if you're ambitious) Chapter 14.6, Image analysis: segmentation, identification, compression.
Our goal is to find tangles in the image of a single letter, an, of the font Times New Roman:

As in the Point Clouds tutorial, our potential features are partitions of the set of all pixels– of letter or the background– into two subsets, the sides of the partitions. These sides are the pairs of features, one for each potential feature or partition, from which our tangles have to choose one.
Unlike in the Point Clouds tutorial, however, we do not generate these partitions mechanically without regard to what the picture shows. Since we know it shows a letter in black on a white background, we can be more selective: we allow as features only subsets of the letter or the entire background.
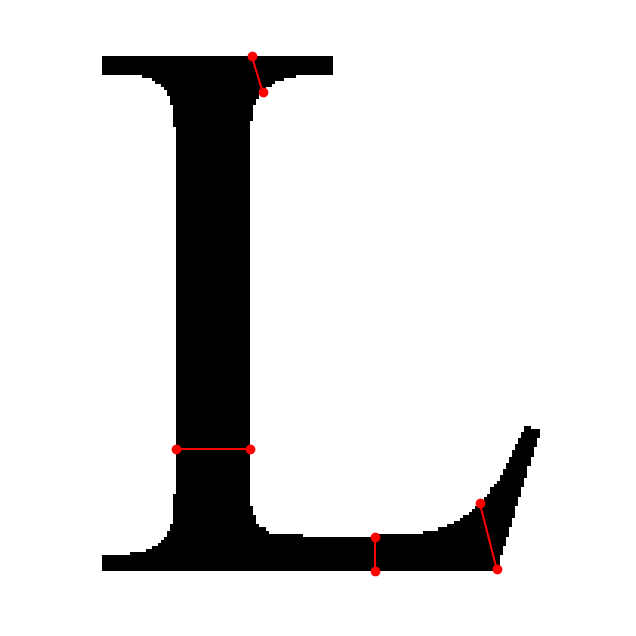
Moreover, we do not consider arbitrary subsets of the but only sets obtained by cutting once through the shape of the letter and then following the edge of the shape round one way or the other:

The tangles we compute are based on a natural order function on these features, which is essentially the length of the red lines in the figure above. More formally, the order of a feature is the number of equally coloured adjacent pixels on opposite sides of its boundary.
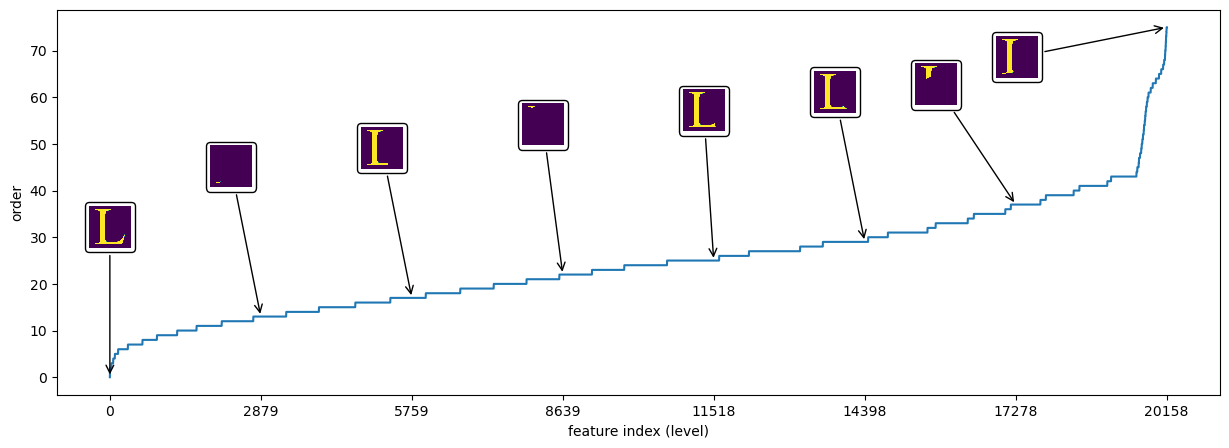
The partition that separates the foreground from the background has the lowest order, zero, since all pairs of adjacent pixels it separates have different colour: one black and the other white. The potential features with slightly larger order are delimited by cuts through the thinnest part of the letter, so that few pairs of adjacent pixels they split have the same colour (black). Some features, listed from left to right in increasing order, are shown here:

Our last plot shows a portion of the tangle search tree (Chapter), and visualisations of the tangles at different levels of this tree. Every tangle is drawn as a heat map, where the intensity of each pixel indicates how much it 'belongs' to that tangle. More formally, a point is bright in the image for a tangle if for many of the partitions it lies on the side chosen by that tangle. Tangles further down in the diagram specify more of the potential features than those higher up.

We can see three groups of tangles corresponding to each of the three serifs of the letter and one tangle for the background.